InfluxDB
1
Install the InfluxDB metric driver on the Plugins page
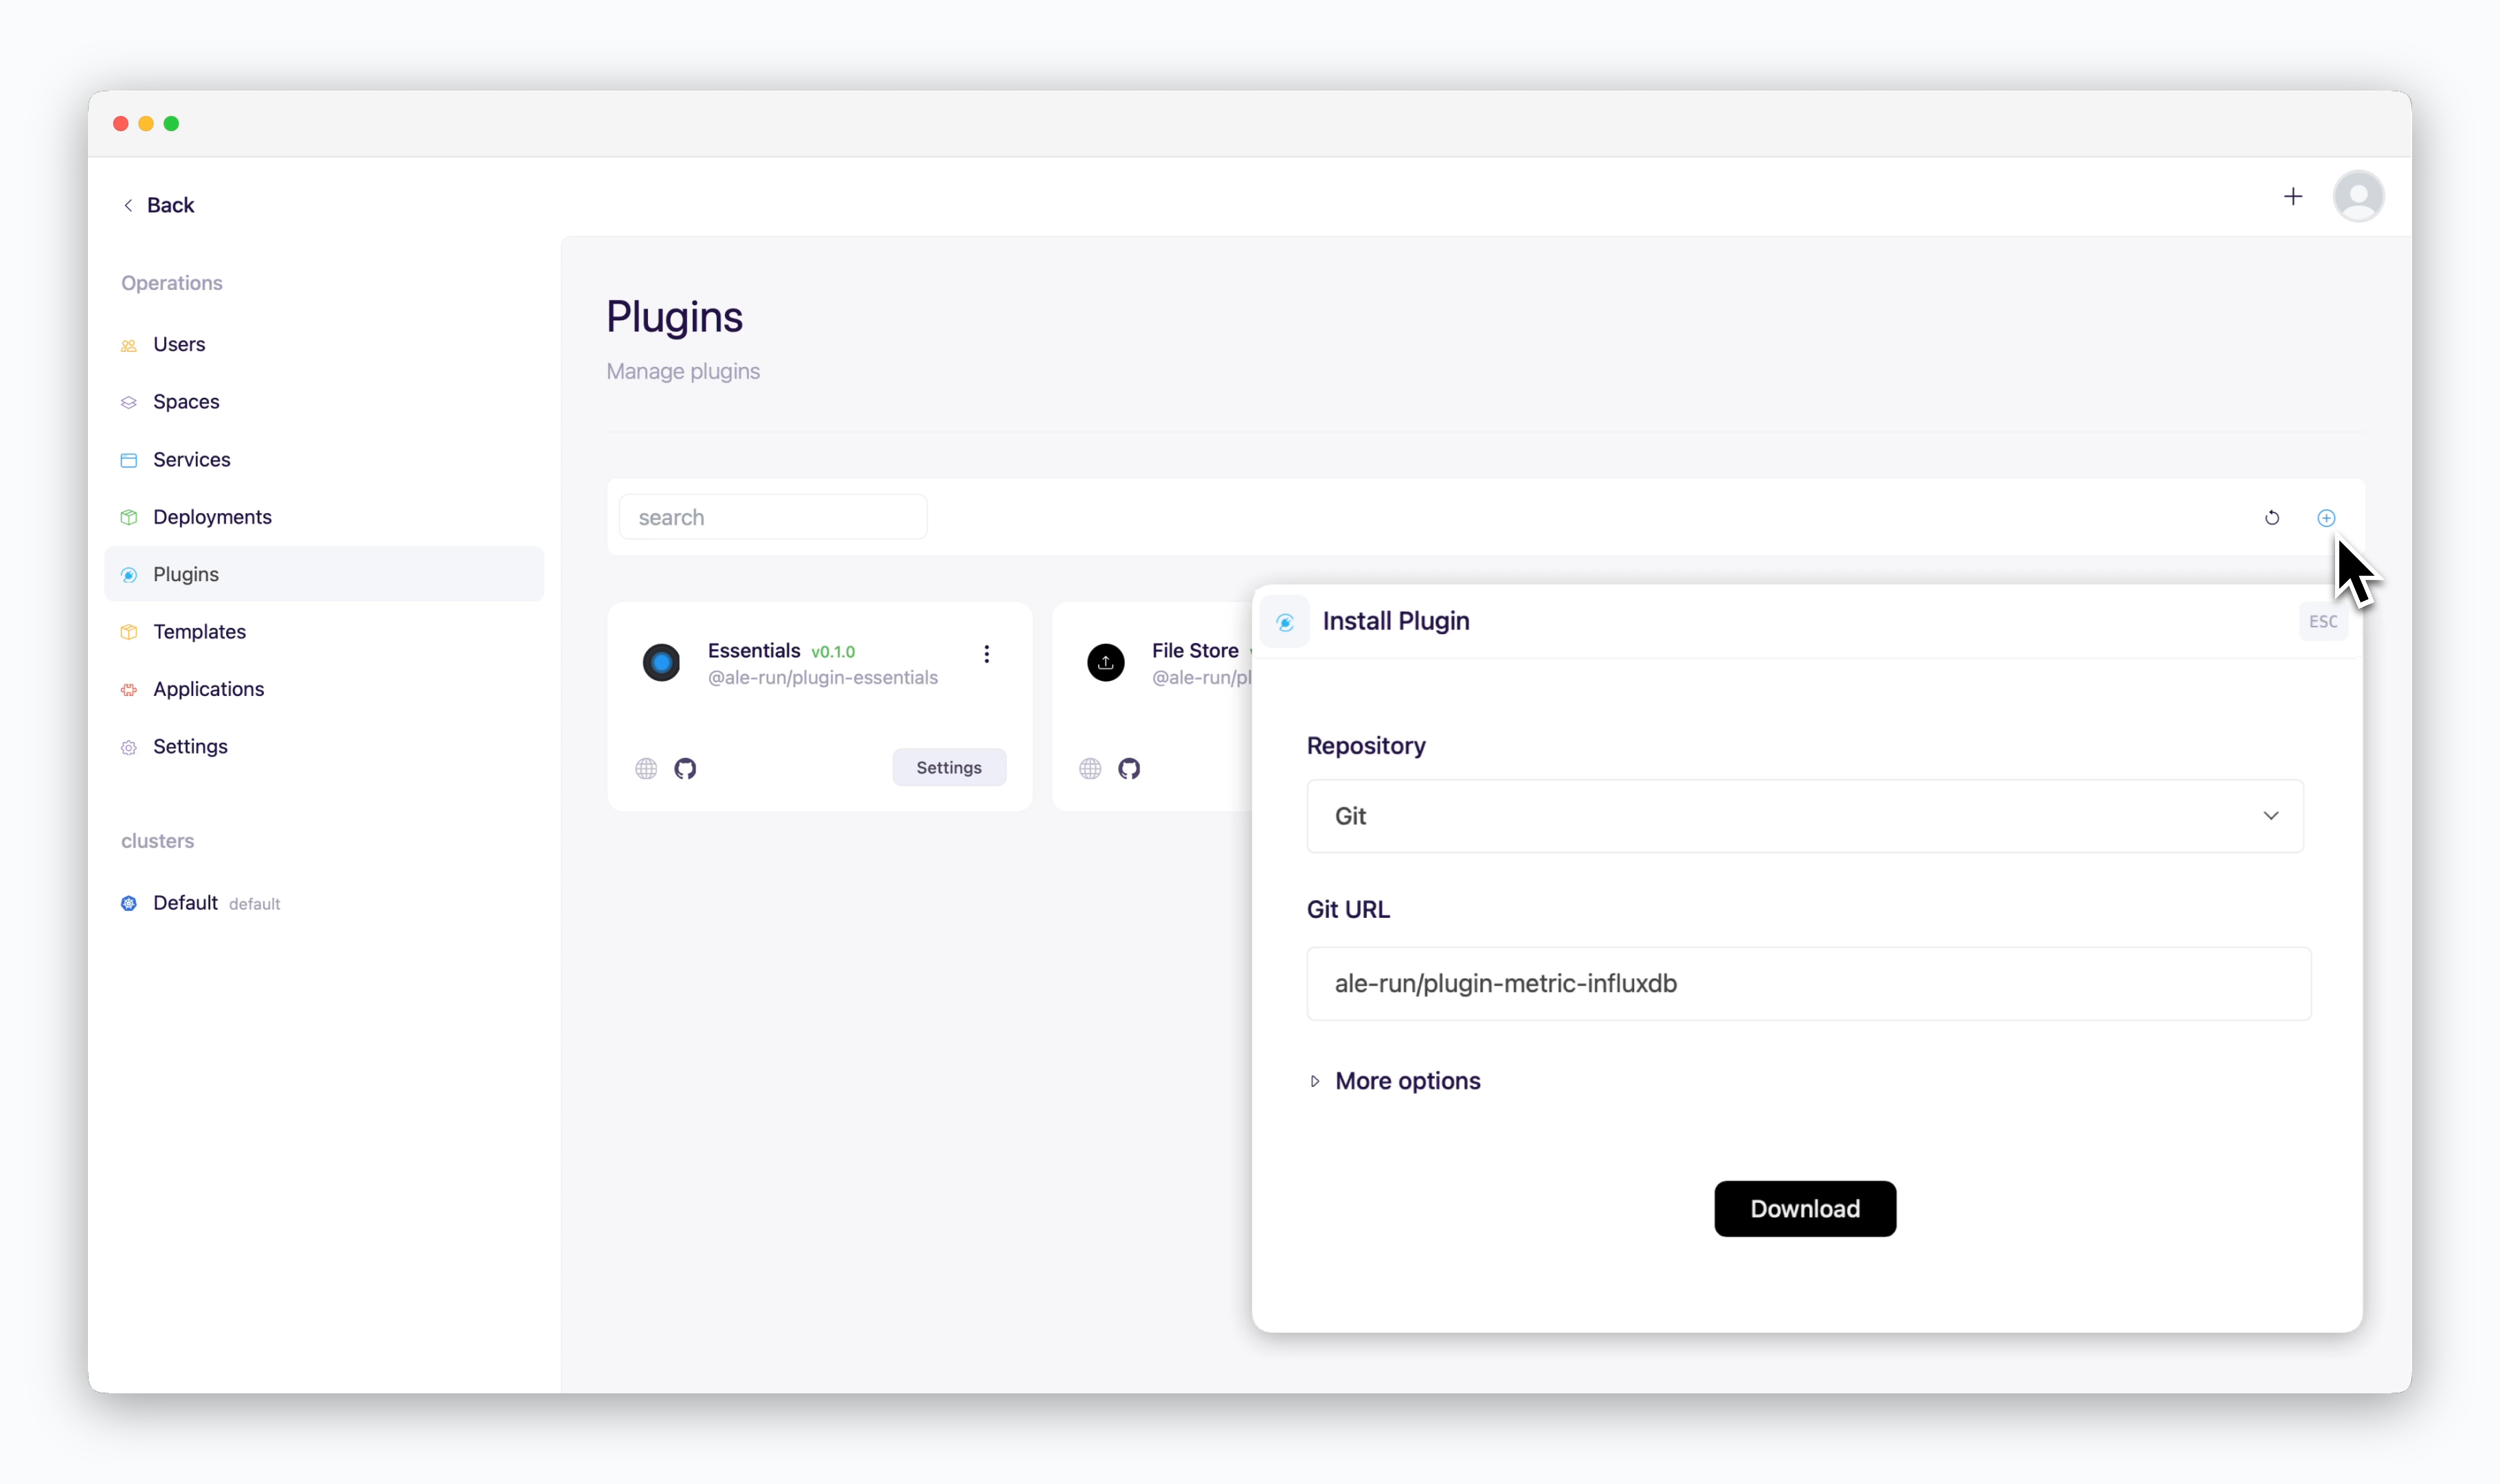
- Repository: Git
- URL: ale-run/plugin-metric-influxdb
2
Go to Settings > Clusters, select your target cluster, and choose InfluxDB as the metric driver. Then add these environment variables under More options:
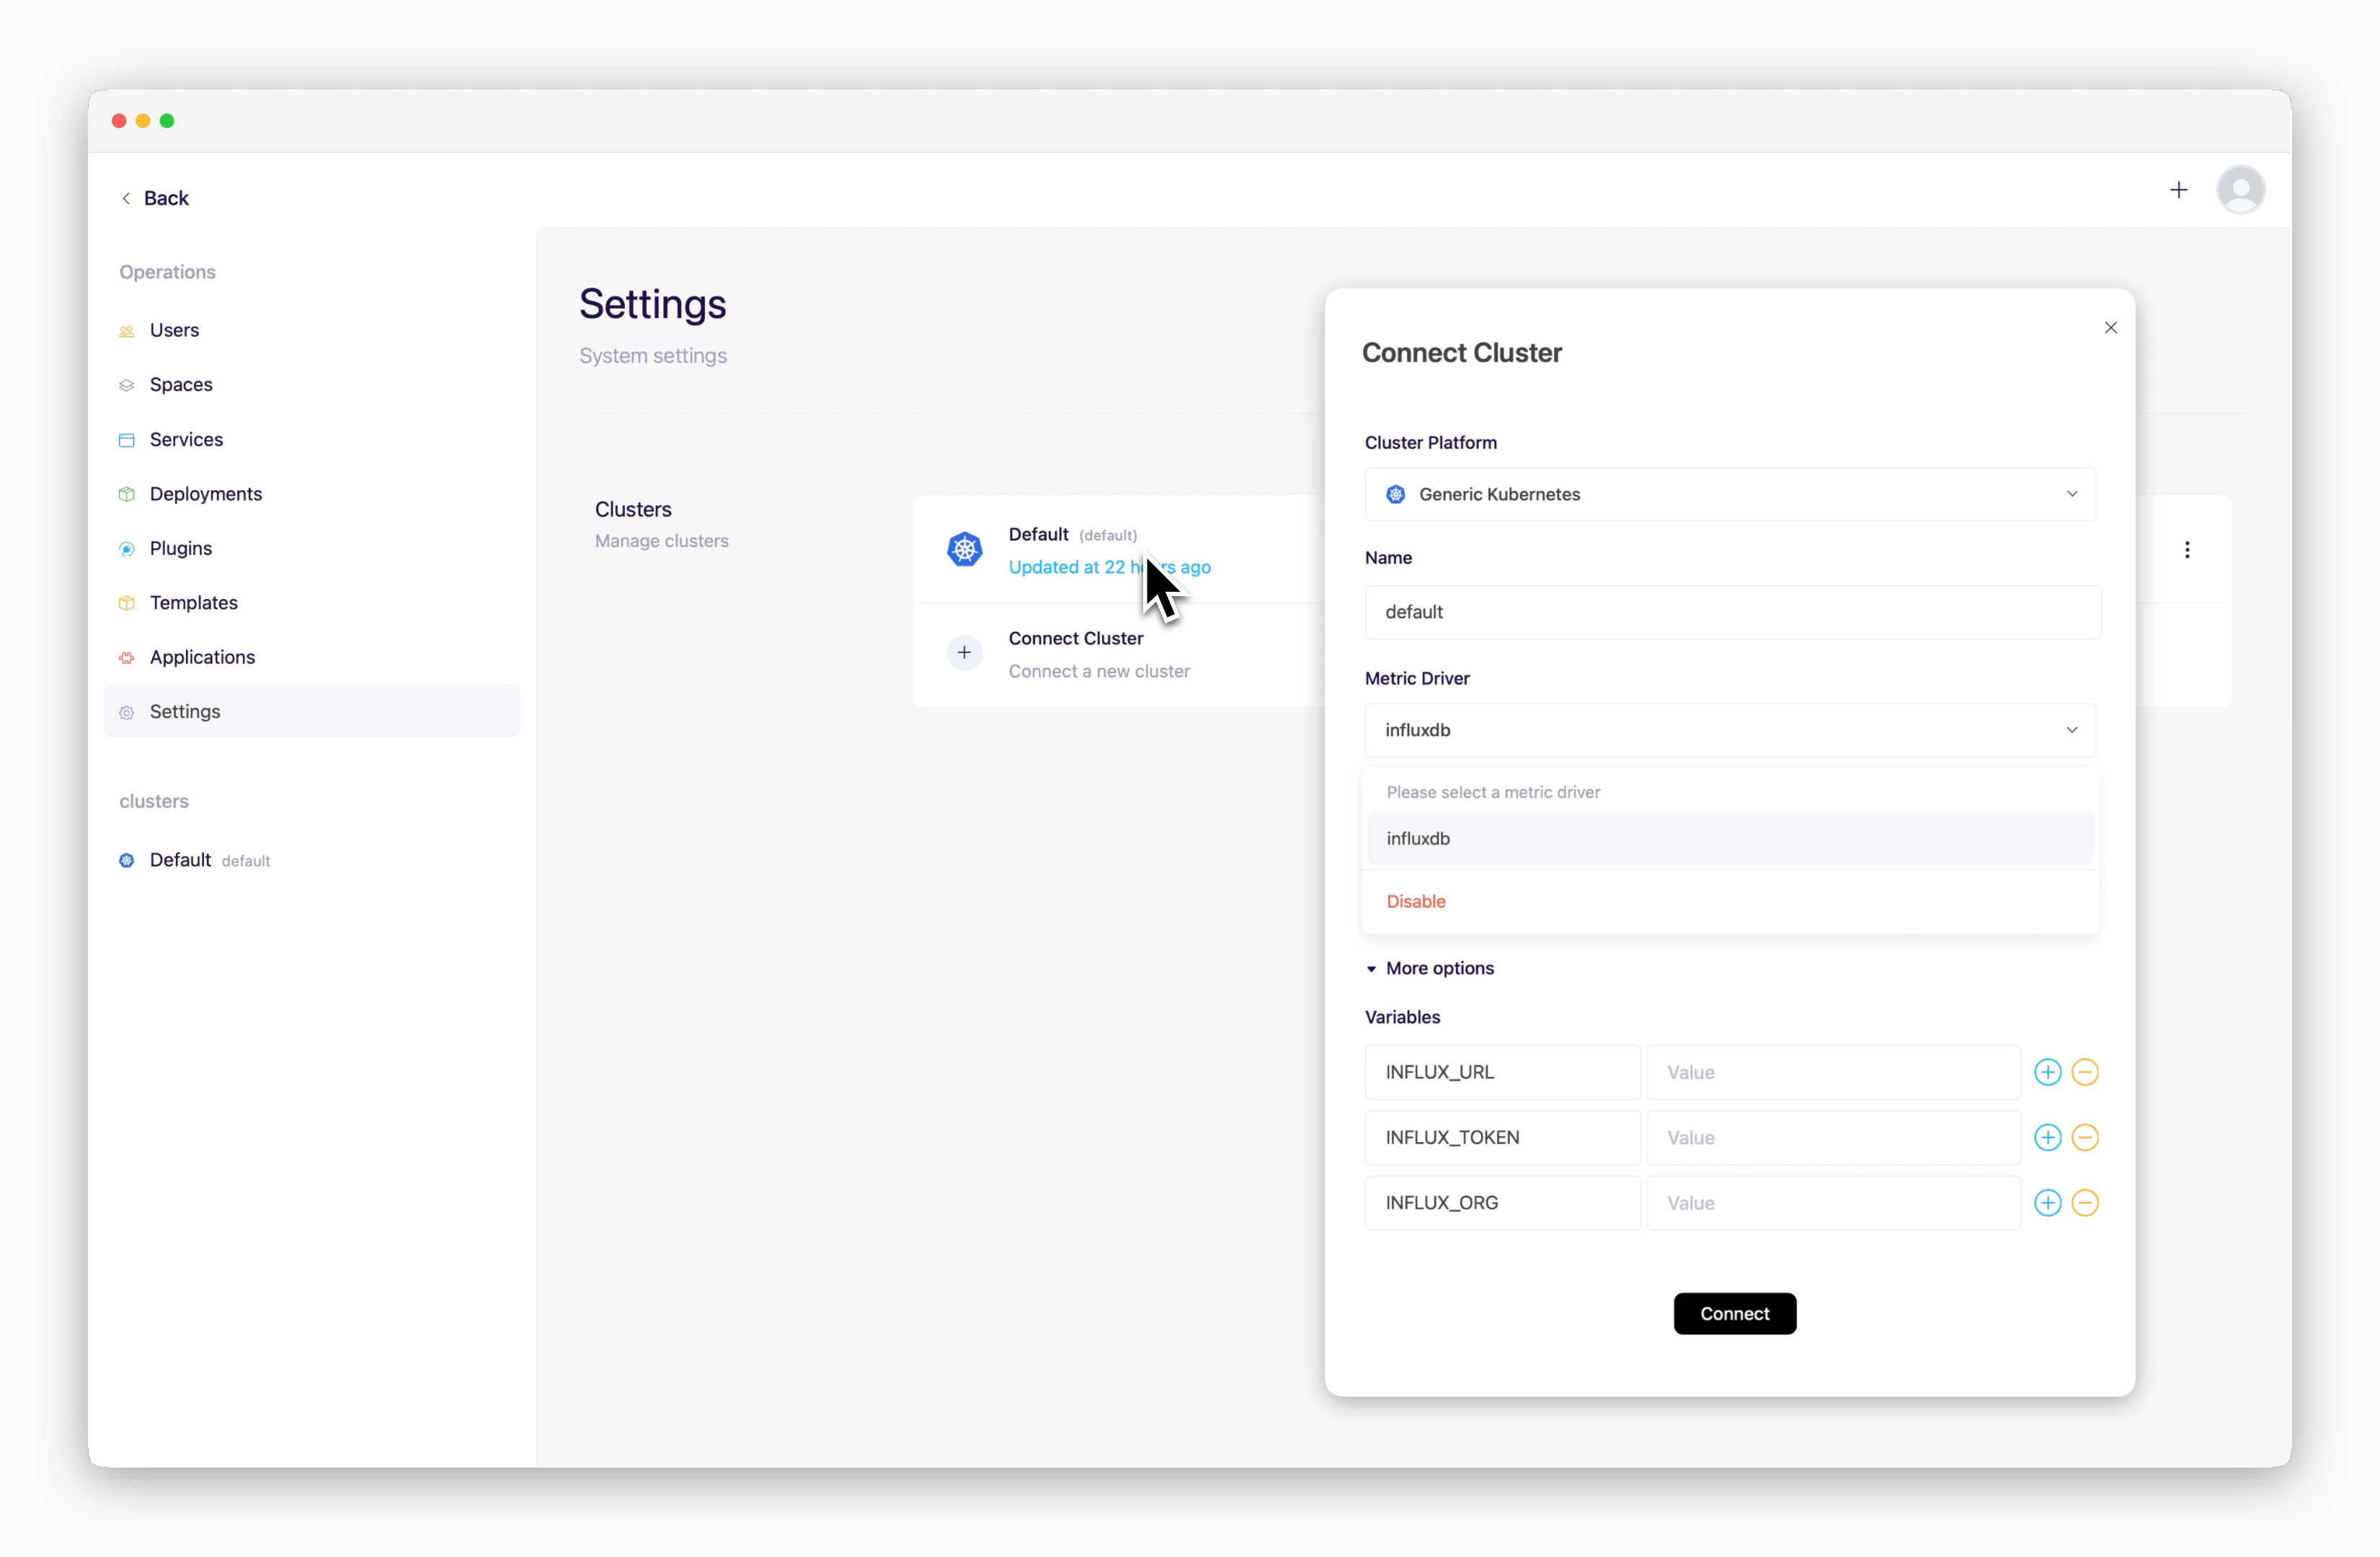
- Environment Variables
INFLUX_URL: InfluxDB server URLINFLUX_TOKEN: InfluxDB access tokenINFLUX_ORG: InfluxDB organization
Prometheus
1
Install the Prometheus metric driver on the Plugins page.

- Repository: Git
- URL: ale-run/plugin-metric-prometheus
2
Go to Settings > Clusters, select your target cluster, and choose Prometheus as the metric driver. Then add this environment variable under More options:

- Environment Variables
PROMETHEUS_URL: Prometheus server URL
AWS CloudWatch
1
Install the AWS CloudWatch metric driver on the Plugins page.
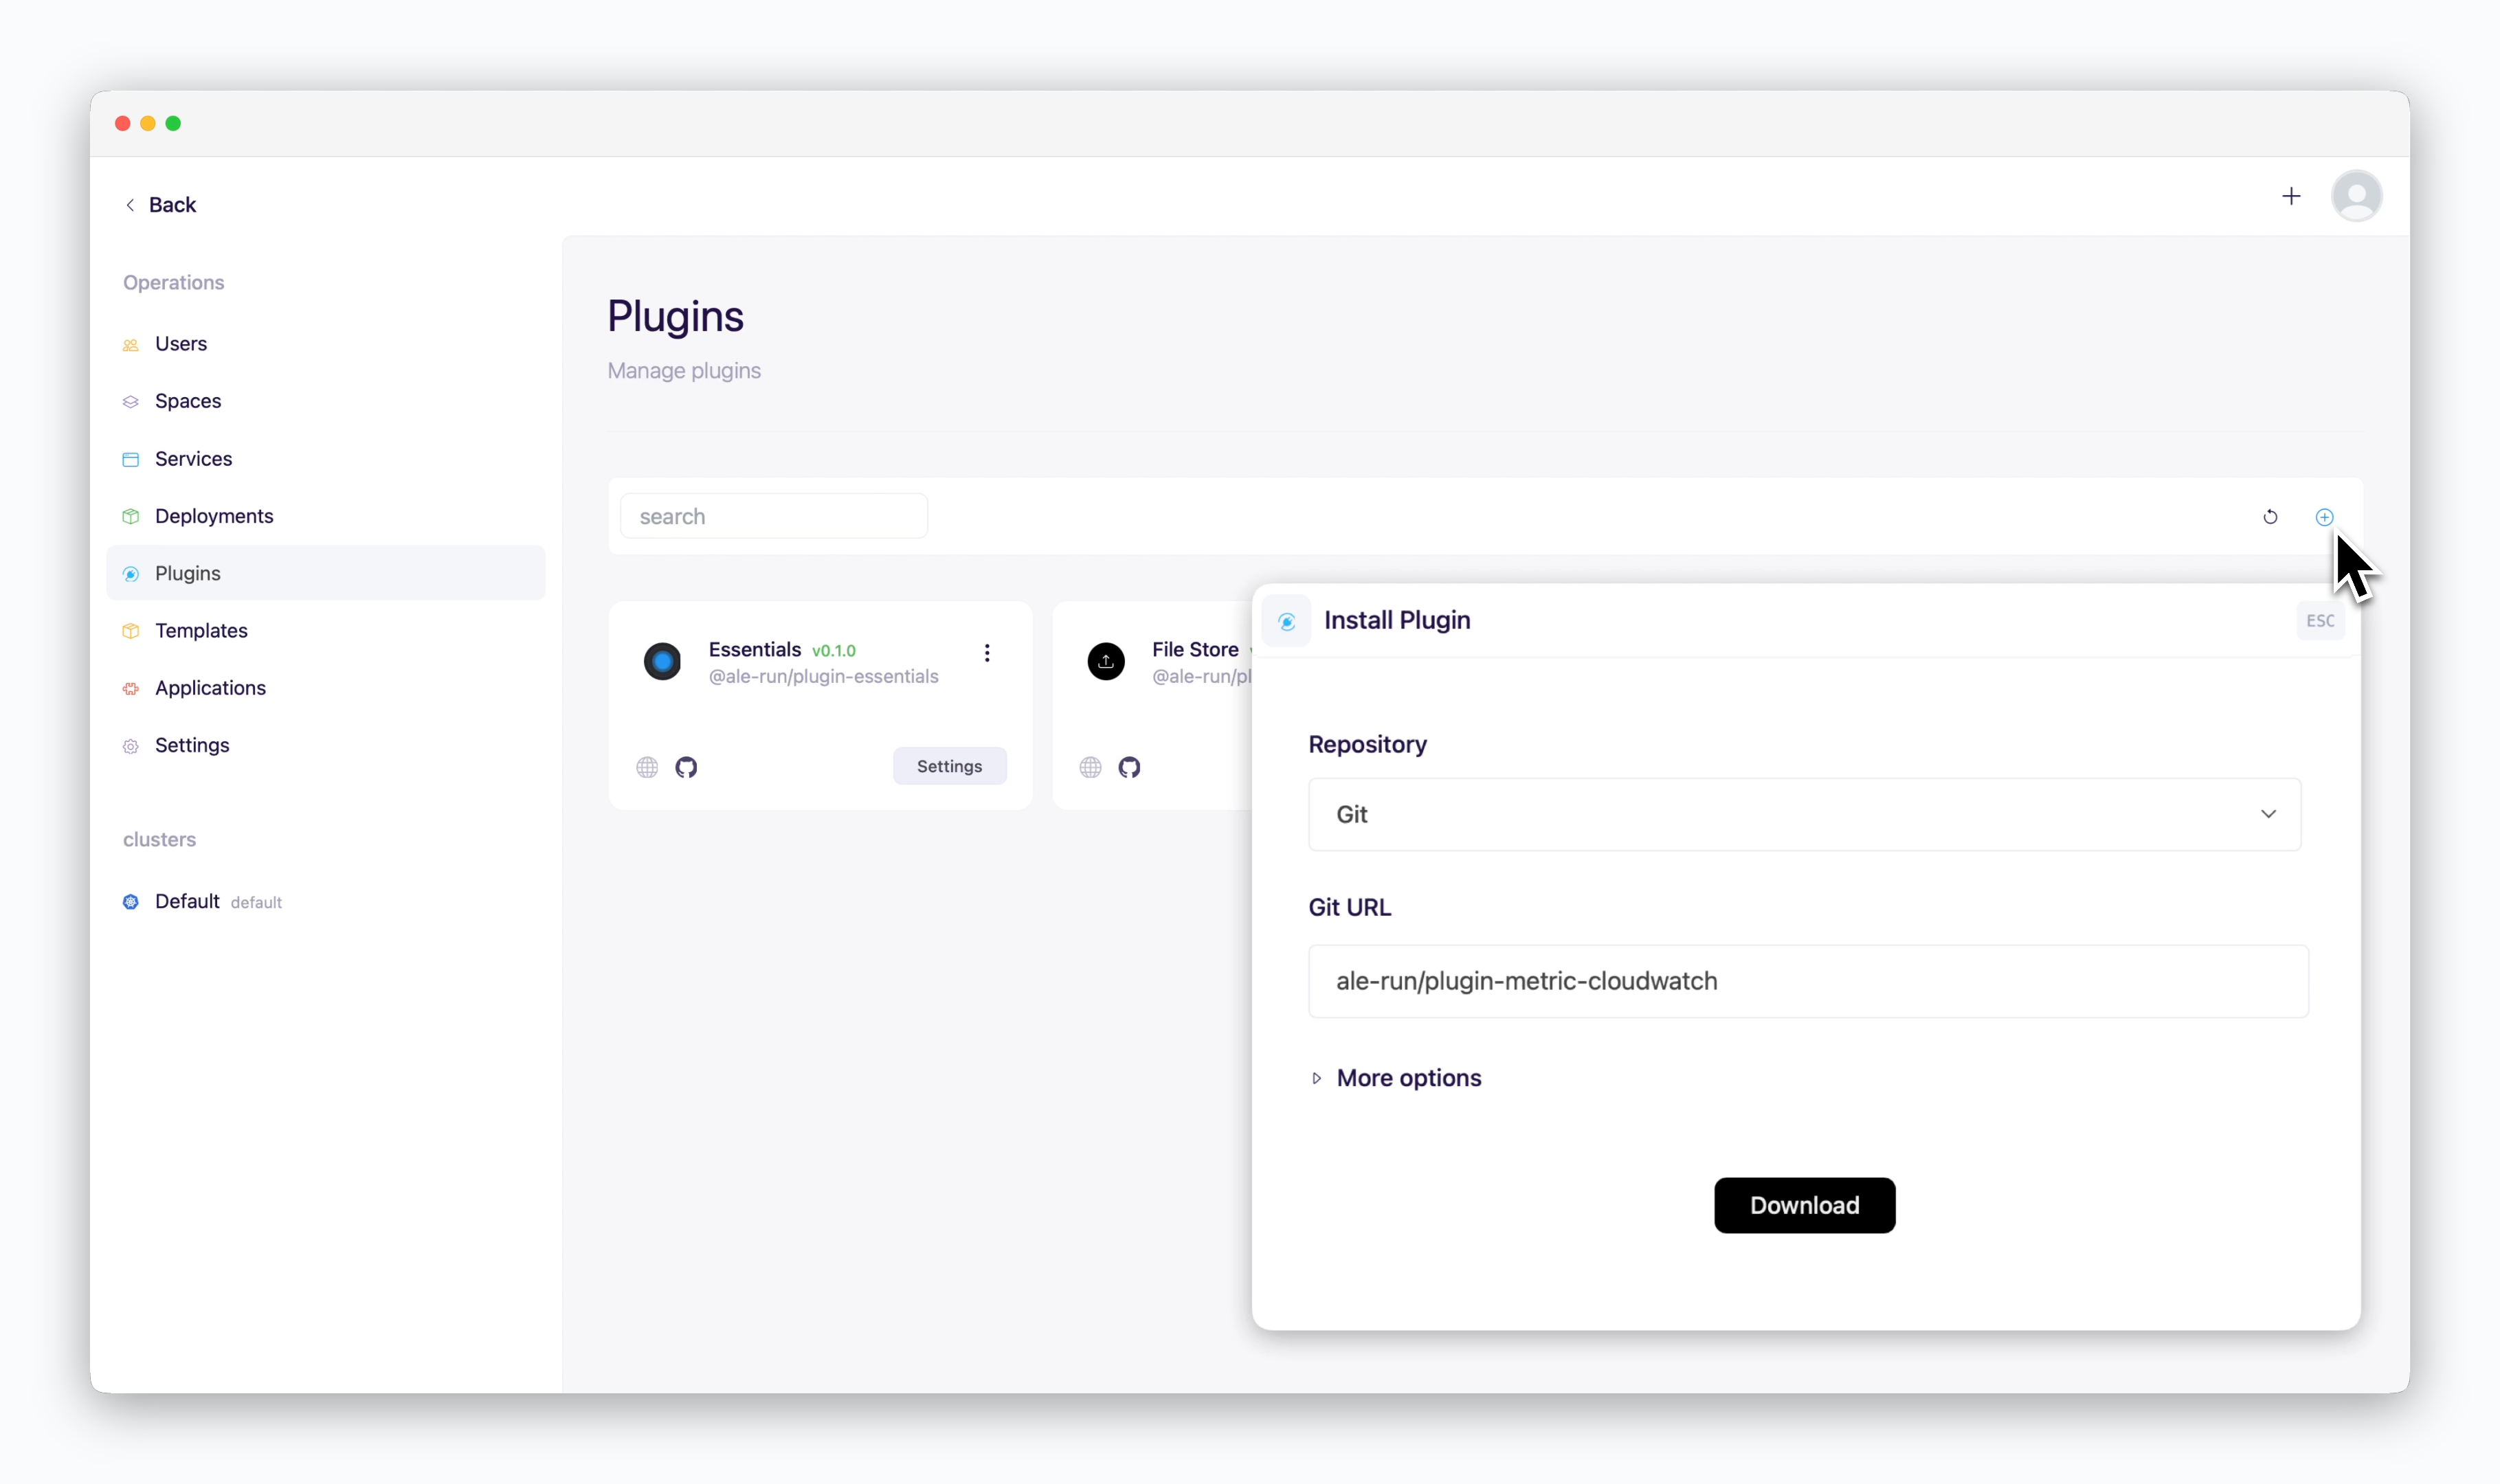
- Repository: Git
- URL: ale-run/plugin-metric-cloudwatch
2
Go to Settings > Clusters, select your target cluster, and choose CloudWatch as the metric driver. Then add these environment variables under More options:
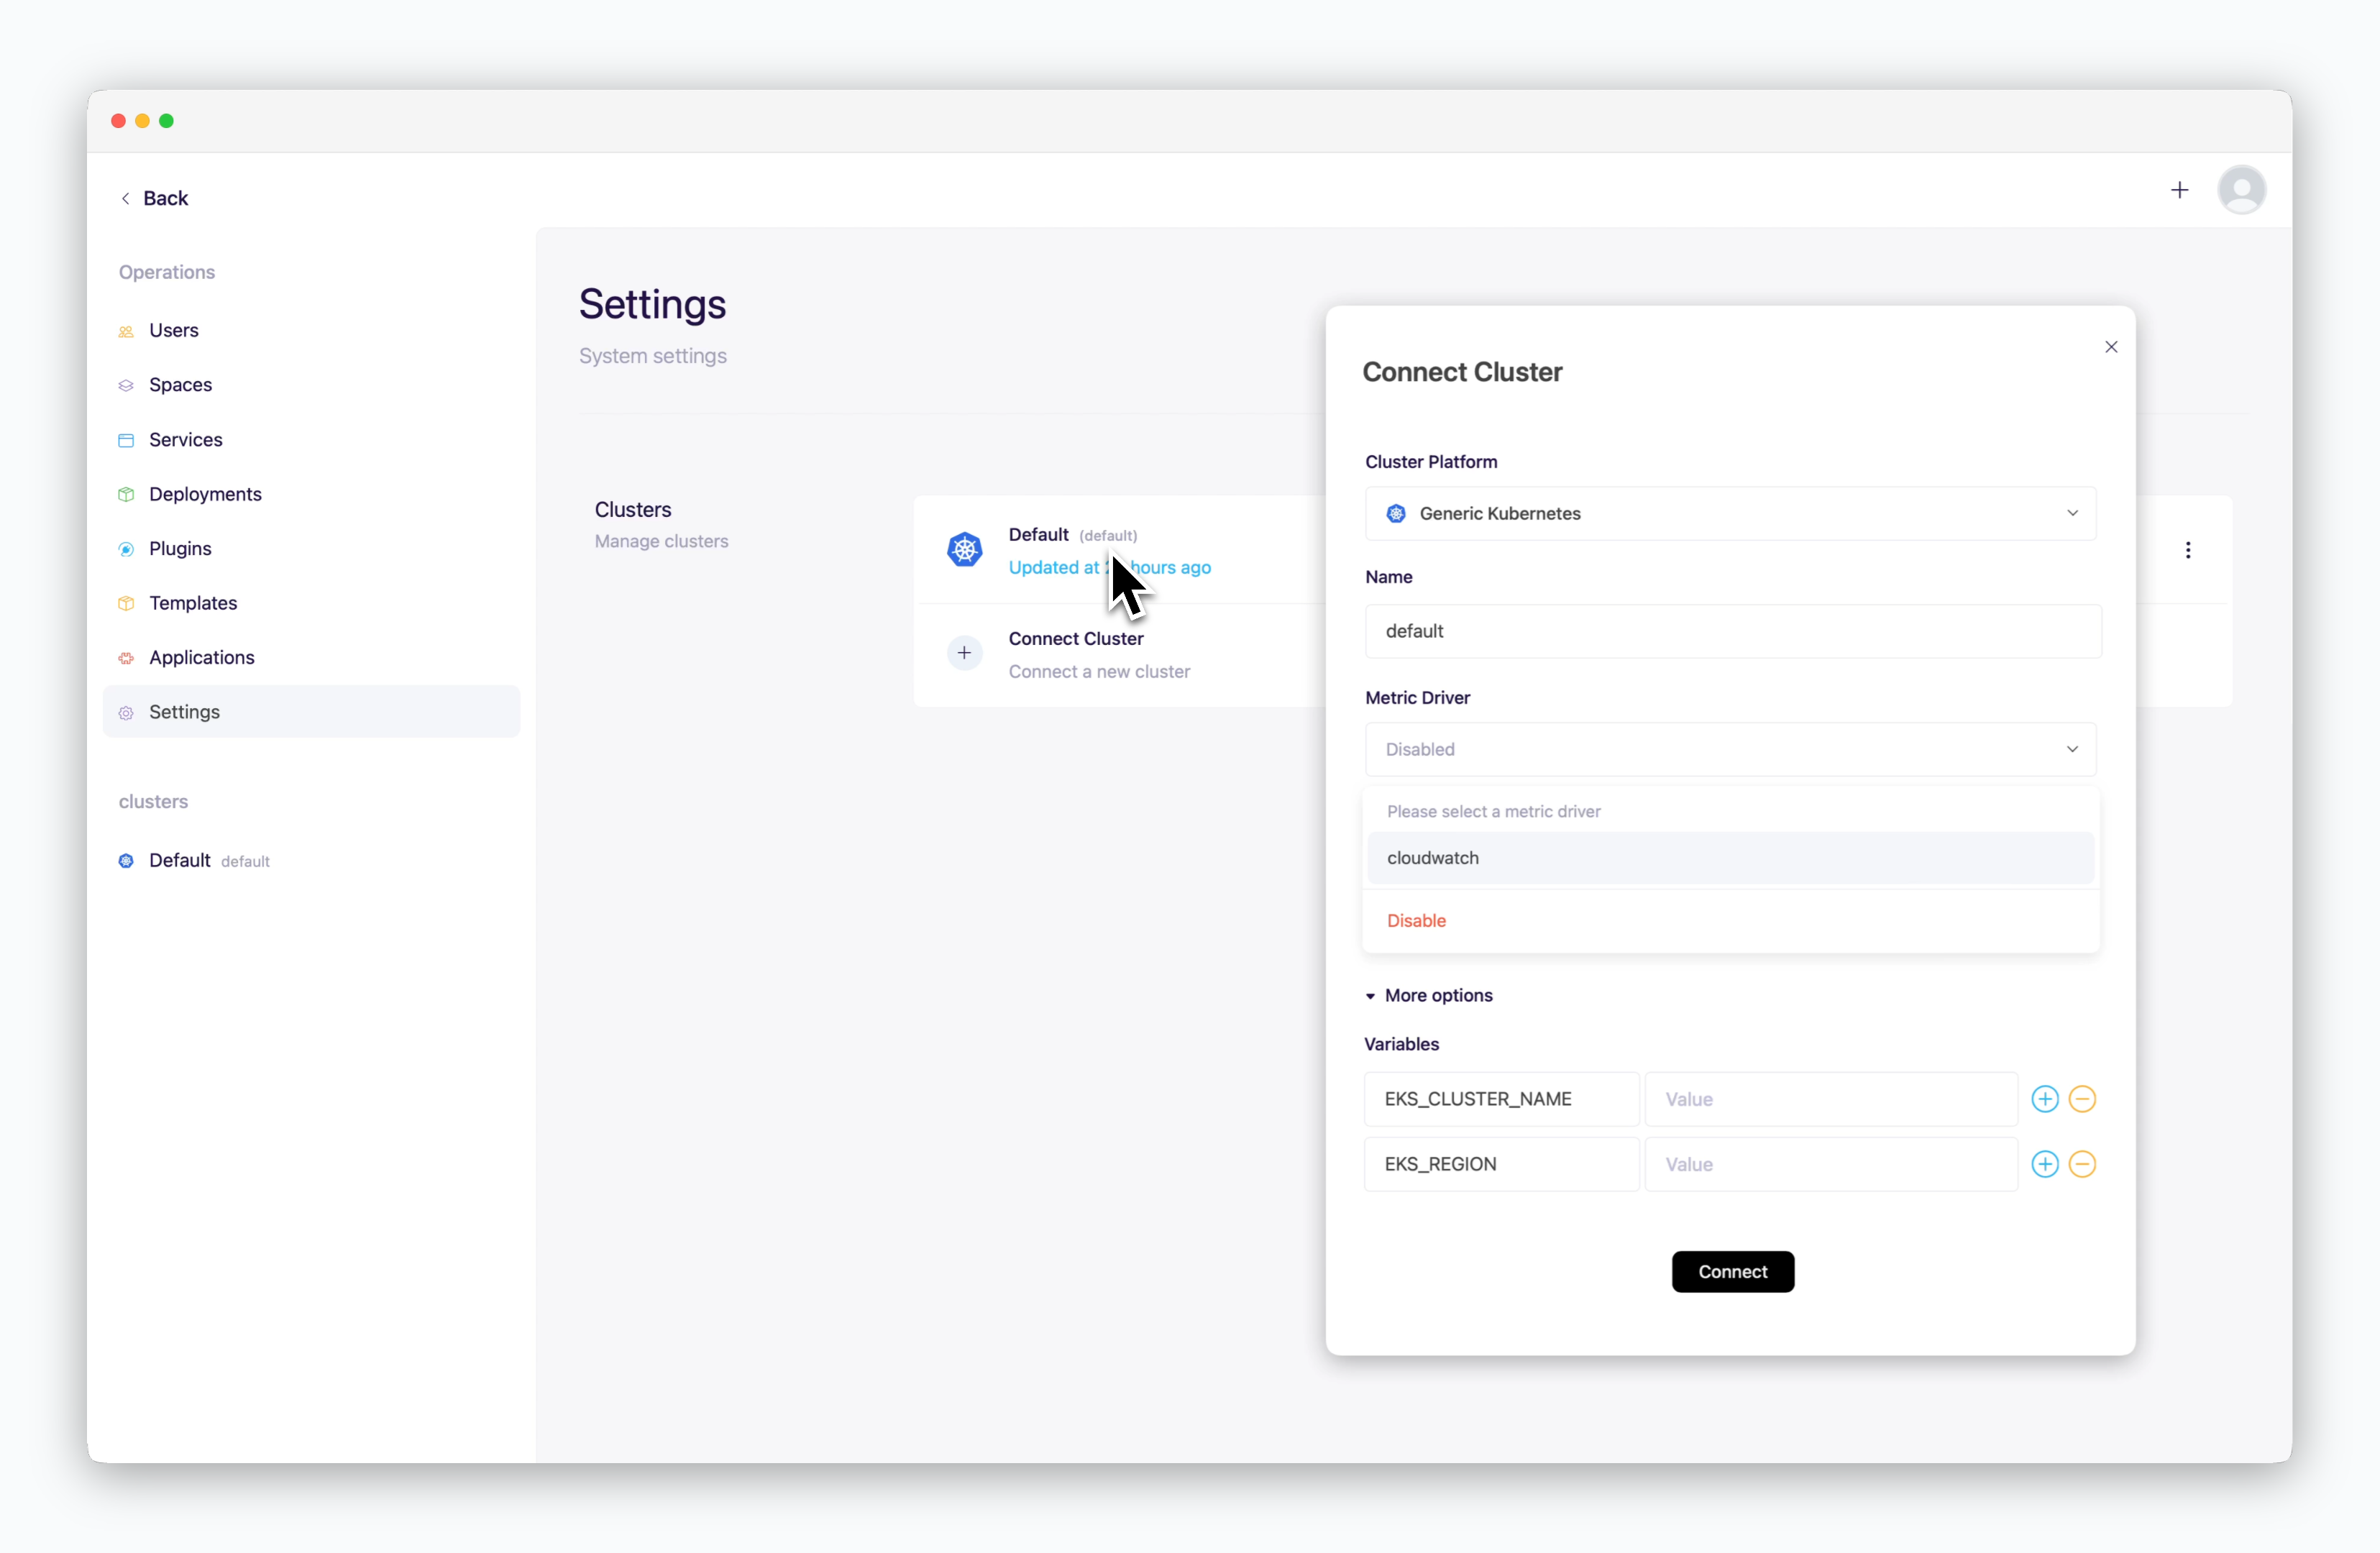
- Environment Variables
EKS_CLUSTER_NAME: Name of your EKS clusterEKS_REGION: Region of your EKS cluster